Y1U1W3
Methods of Iterating
Question:
How can I expand Gephi as a tool for systematic pattern design?
The final week of the project focused on understanding and developing specific tools through iterative experimentation with the software. I explored systematic pattern design around the overarching questions from the previous project. Exploring design methods under constraints, I found the manifesto statement of the Conditional Design Workbook: “Avoid arbitrary randomness. Difference should have a reason.” (p.2) as a guide.
By repurposing the tool as a visual representation, I had to remove unexplained elements in order to systematise the abstract image. I re-analysed the graphic output, which was not a network-like graphic from the previous project. I then identified the following variables and elements

This ensures that different characteristics of lines and shapes, such as size and colour, are influenced by different elements, but ultimately work in one unified system.
By using ‘Gephi’ for visual representation rather than data visualisation, I was able to create a mathematically organised design system to logically explain unpredictable and randomly appearing graphics.
Input
Through experimentation, I used ‘Gephi’ to focus on (self-)expression, which had been highlighted in previous feedback. Instead of randomly scraping social network data from unknown websites as in previous projects, I used words with abstract concepts as data to represent them. This is because I wanted to see how abstract words are translated into images through a data system.
To find abstract words, I collected descriptions of ‘night’ from a novel I’d recently read and organised them using a data system.
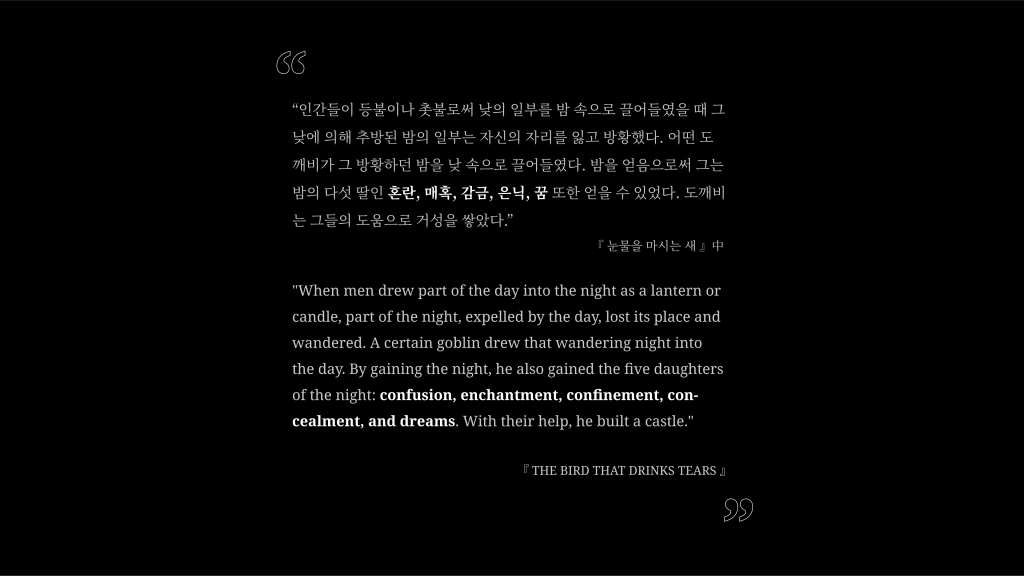
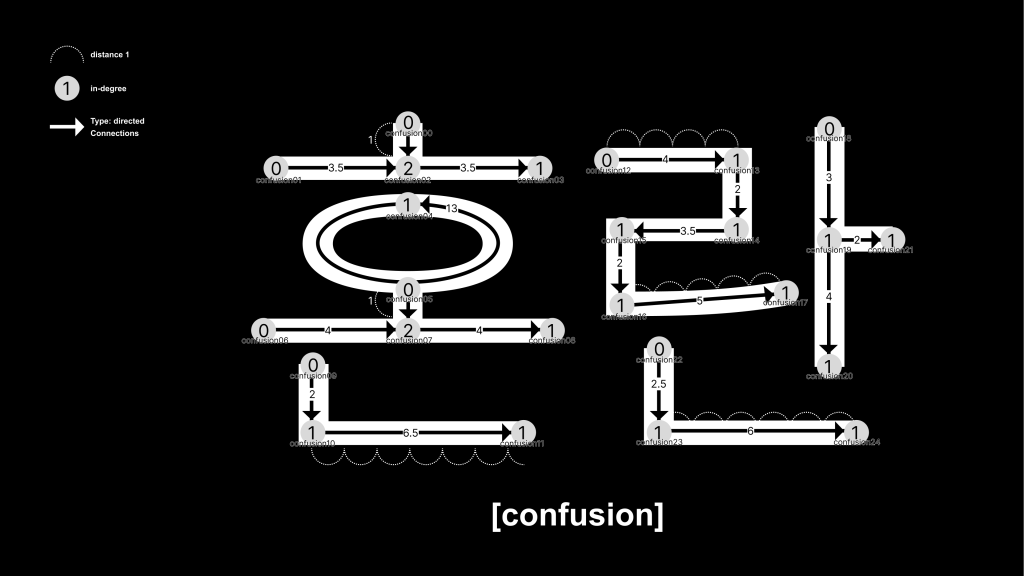
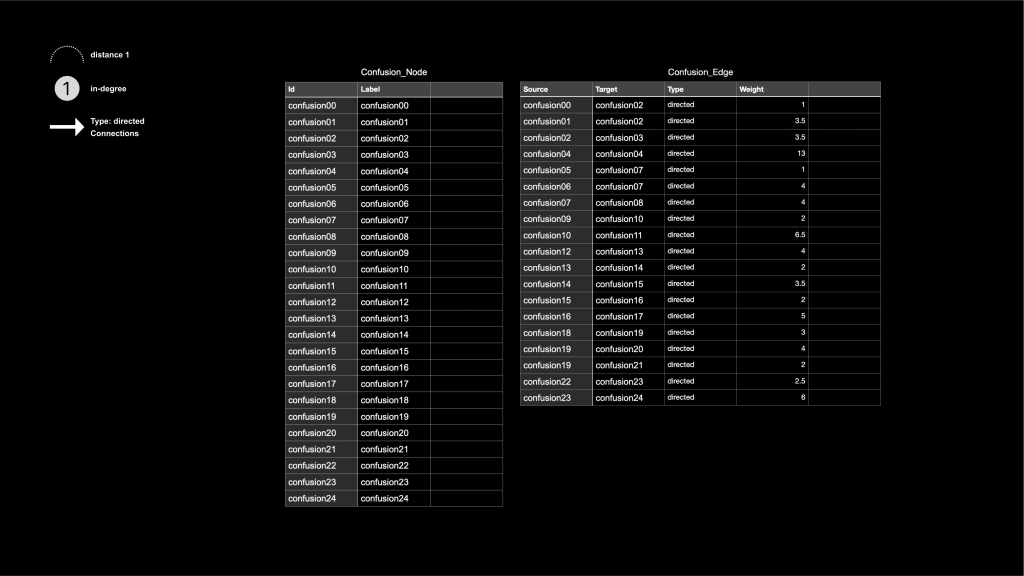
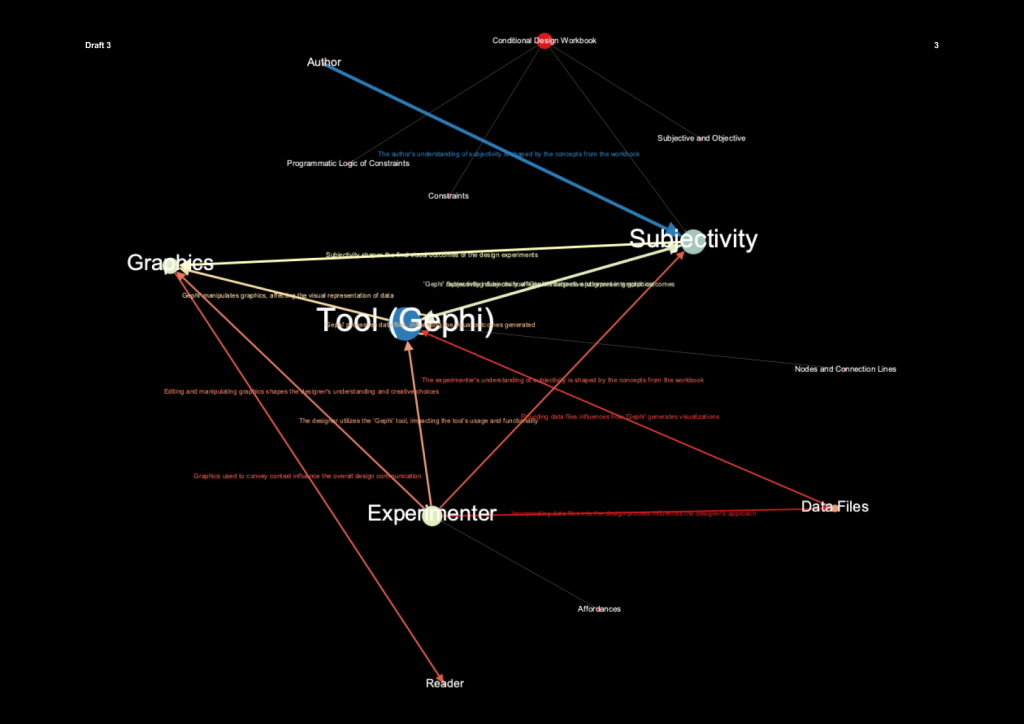
Since ‘Gephi’ is mainly used as mathematical and network data, it was necessary to organise the words into a system, so I dissected them into nodes and connecting lines to make them fit into the system.
I could have used it like any other graphic editing software without this process, but it would have been easy to introduce subjectivity, which would have separated the graphics from each other and prevented them from connecting with the system. I tried to use the most of the characteristics of ‘Gephi’ to make it a ‘data system’.

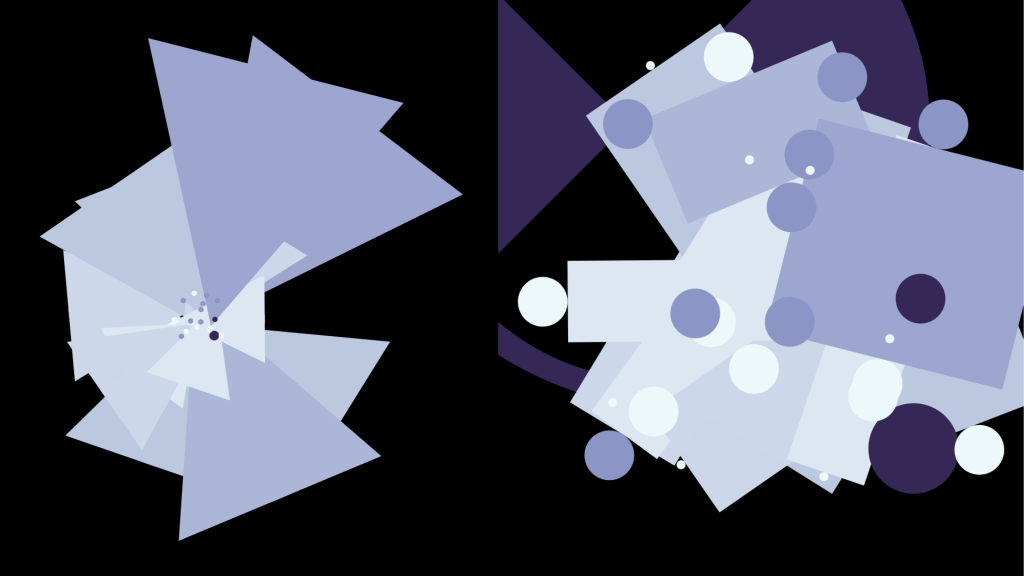
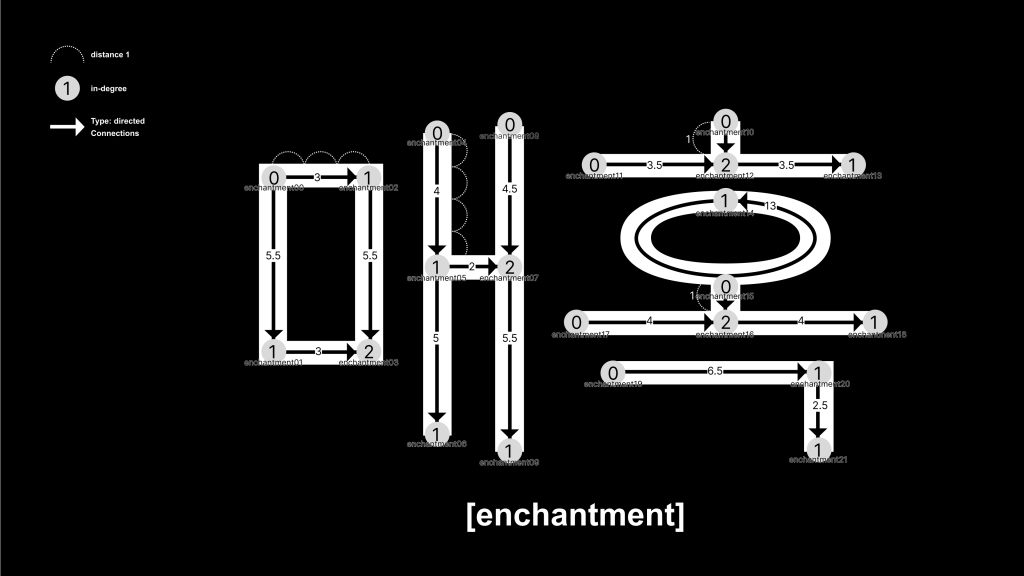
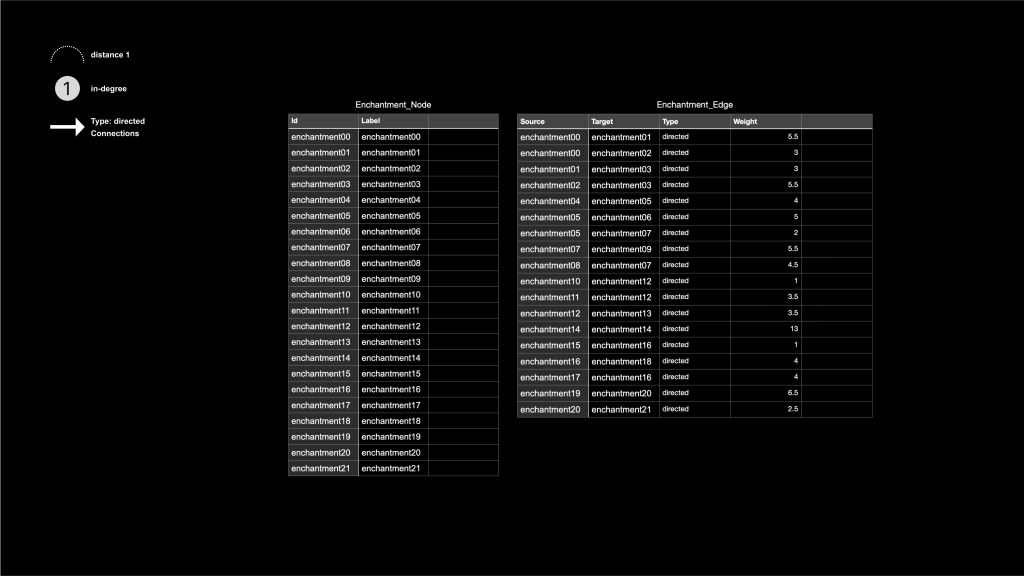
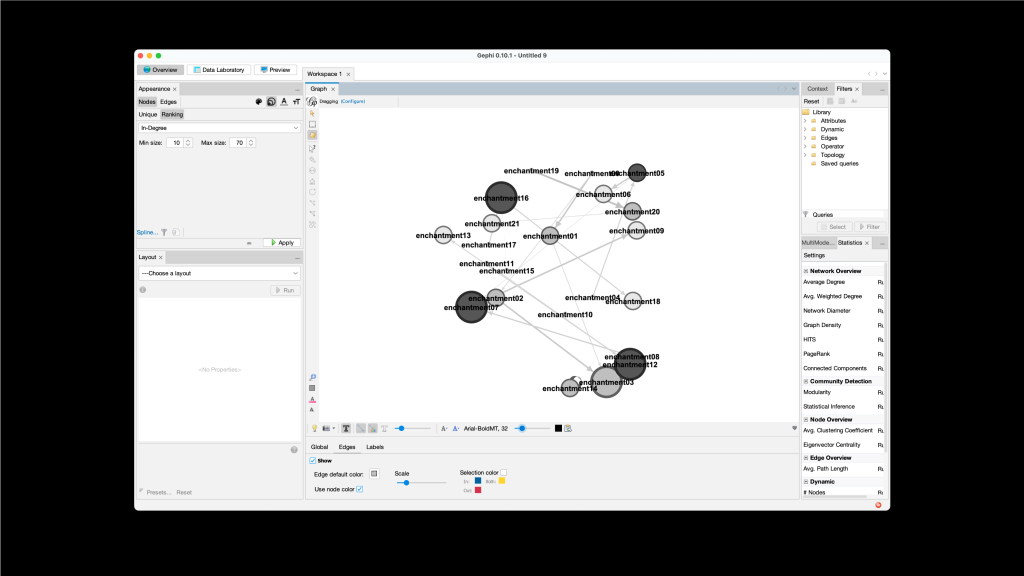
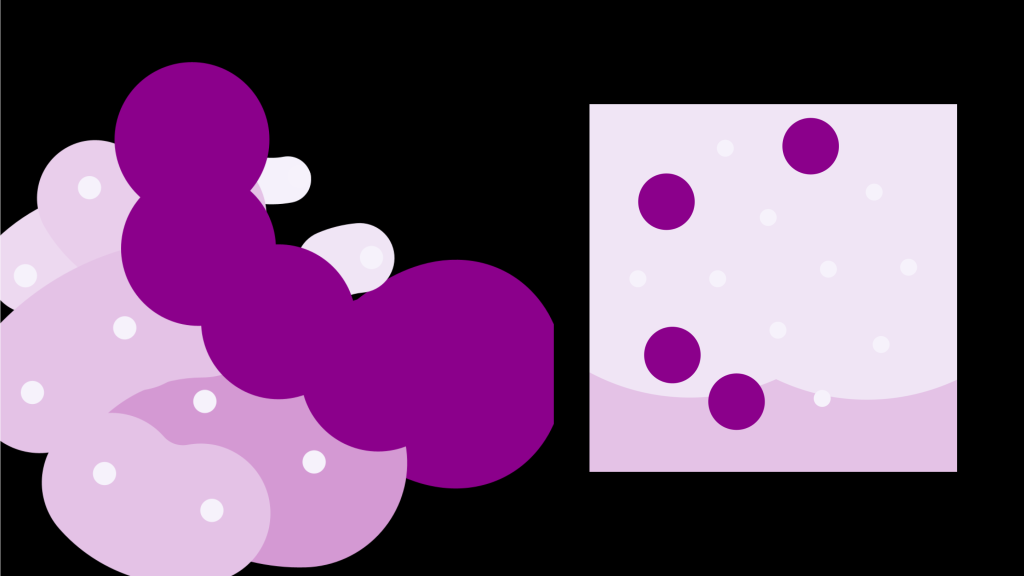
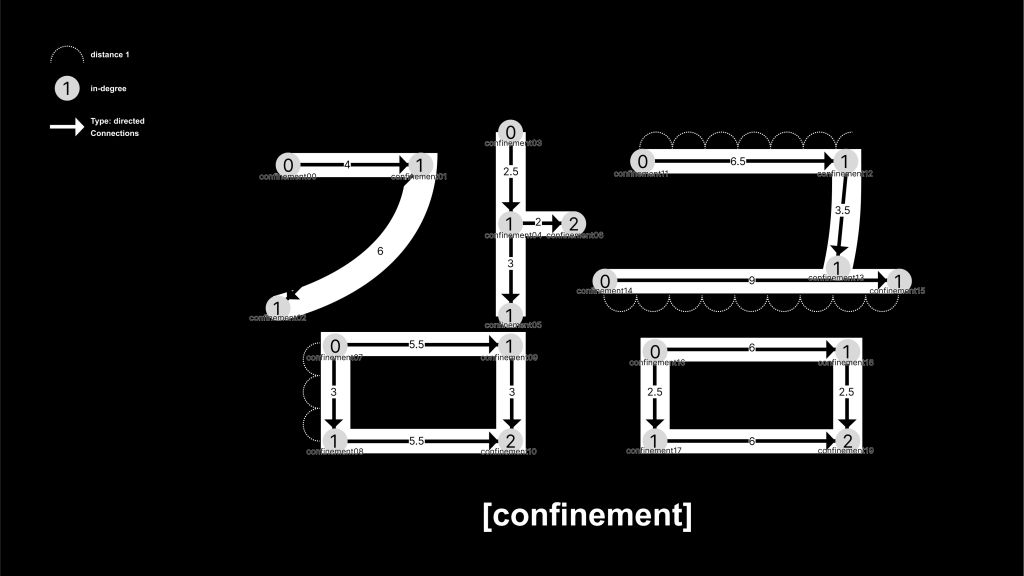
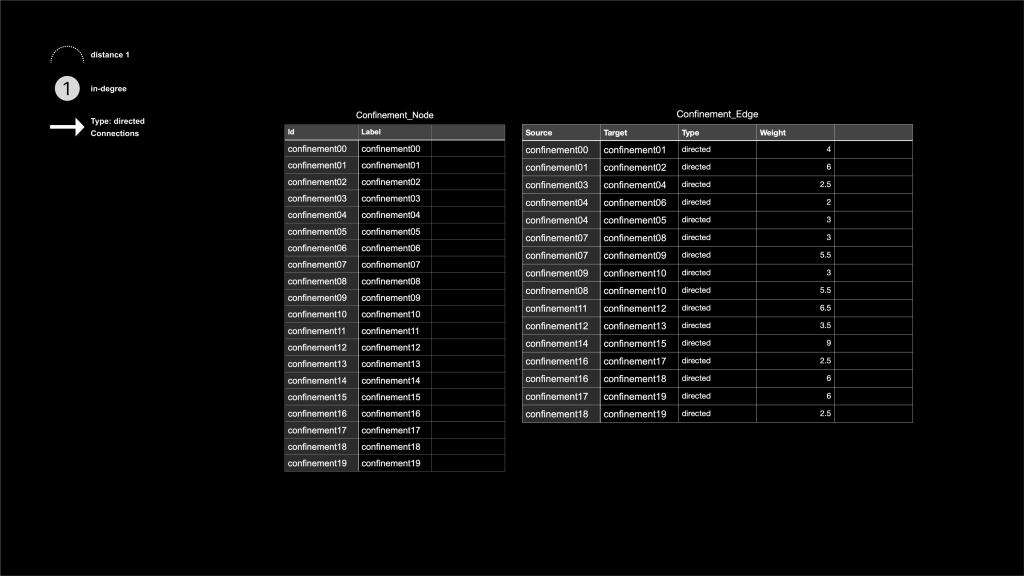
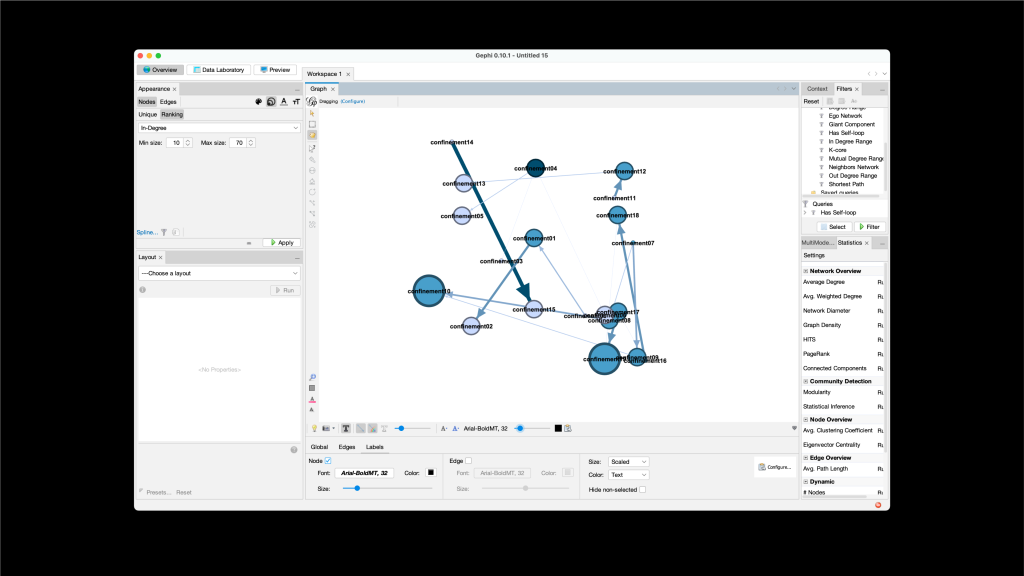
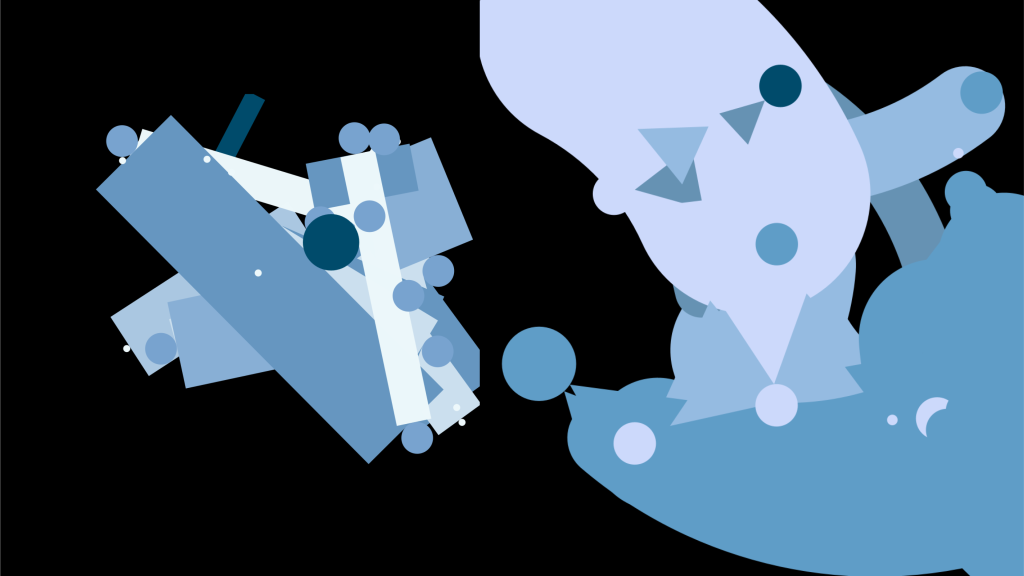
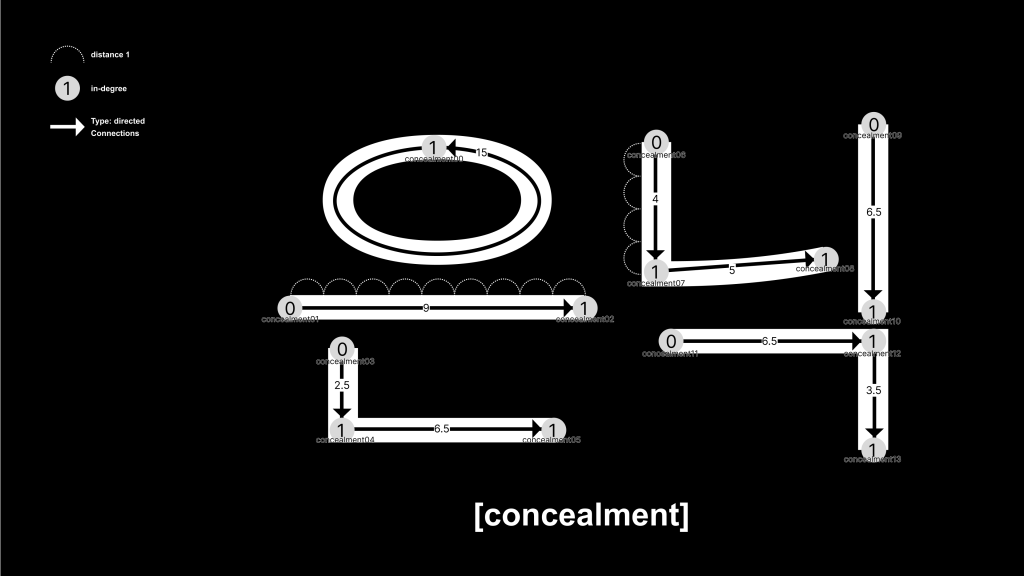
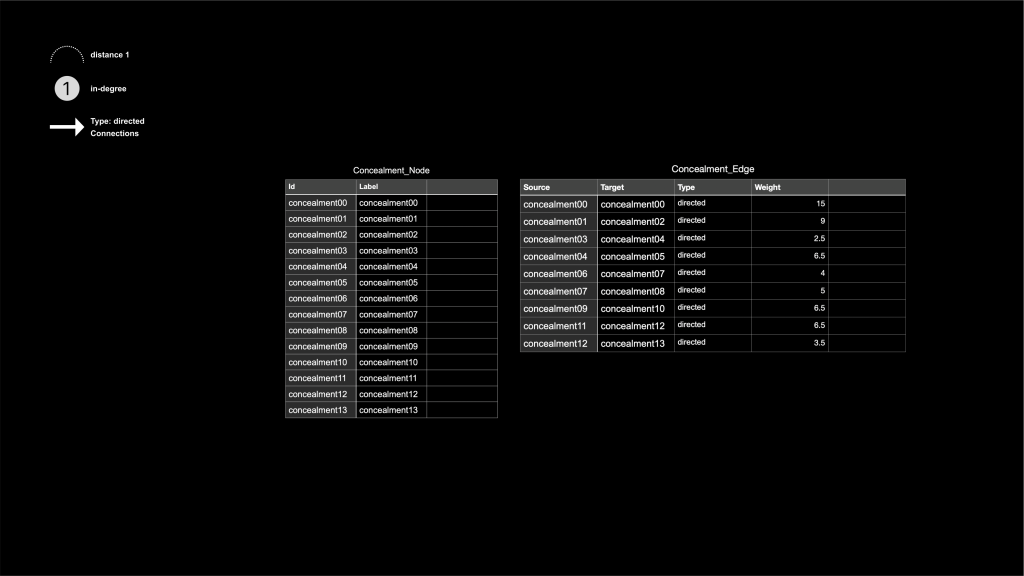
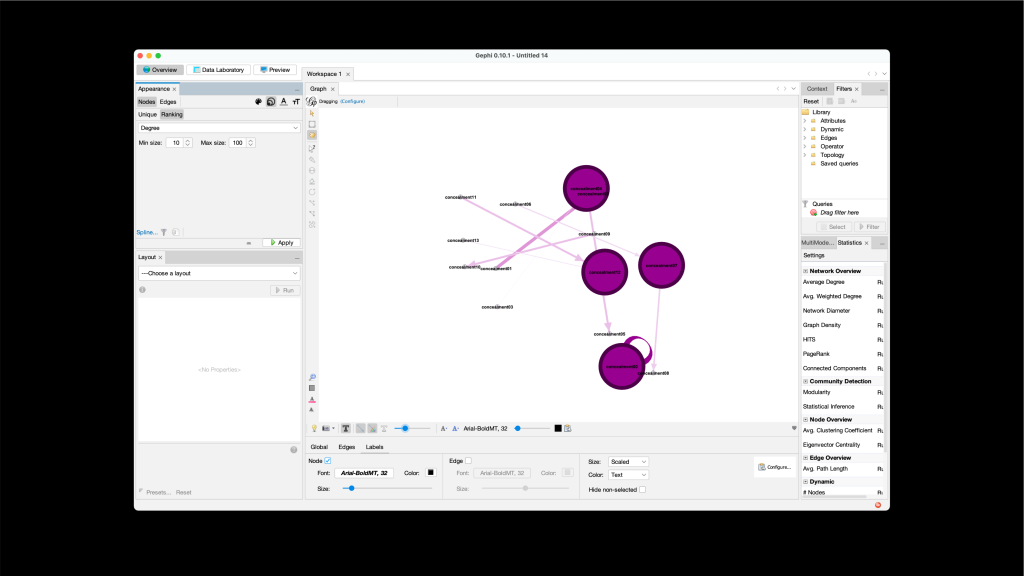
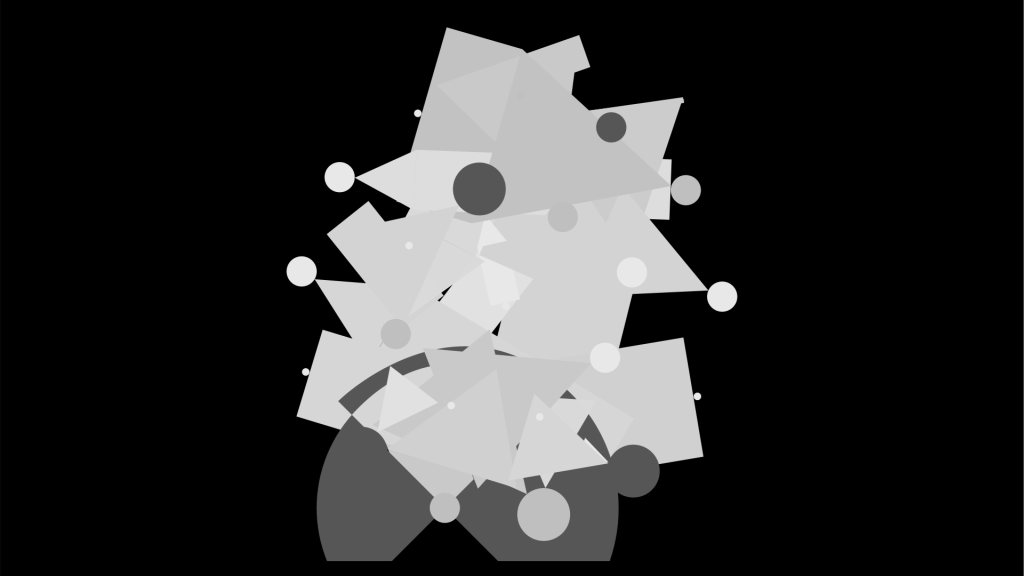
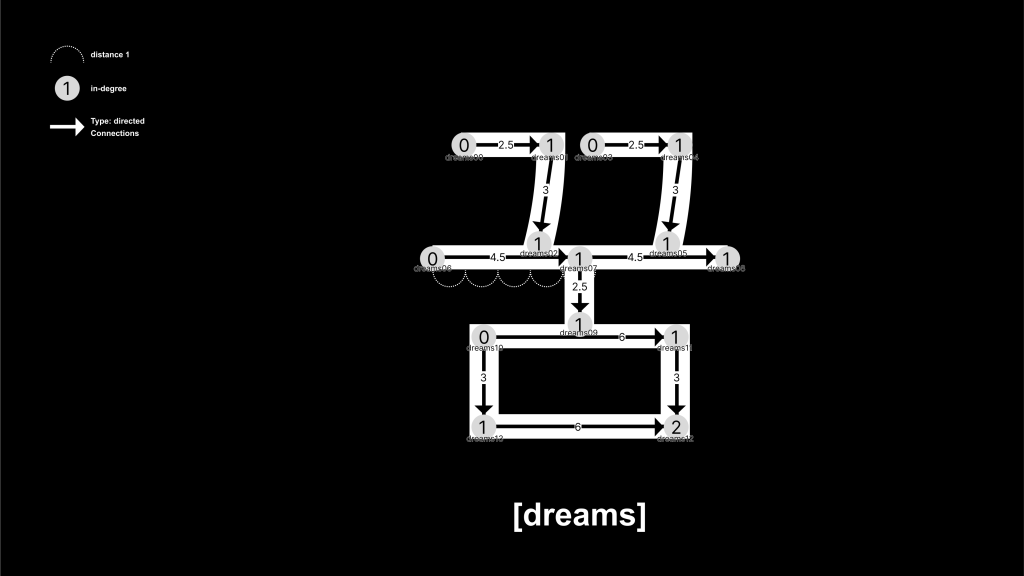
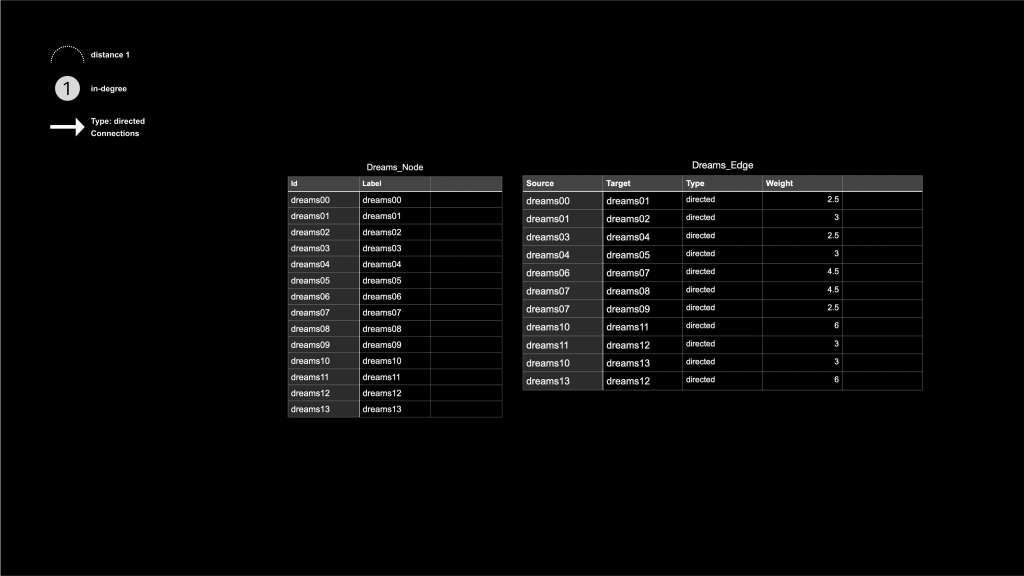
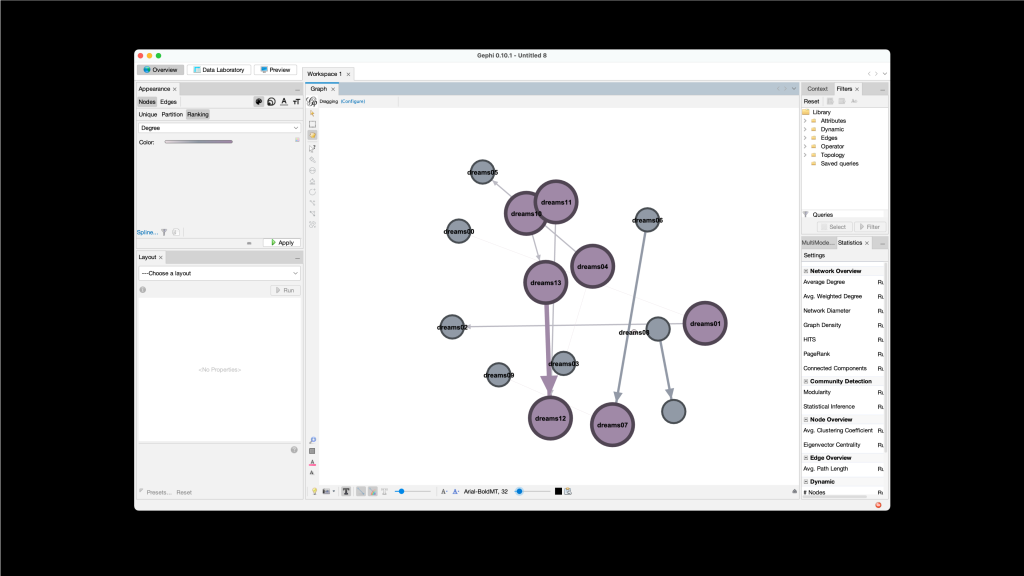
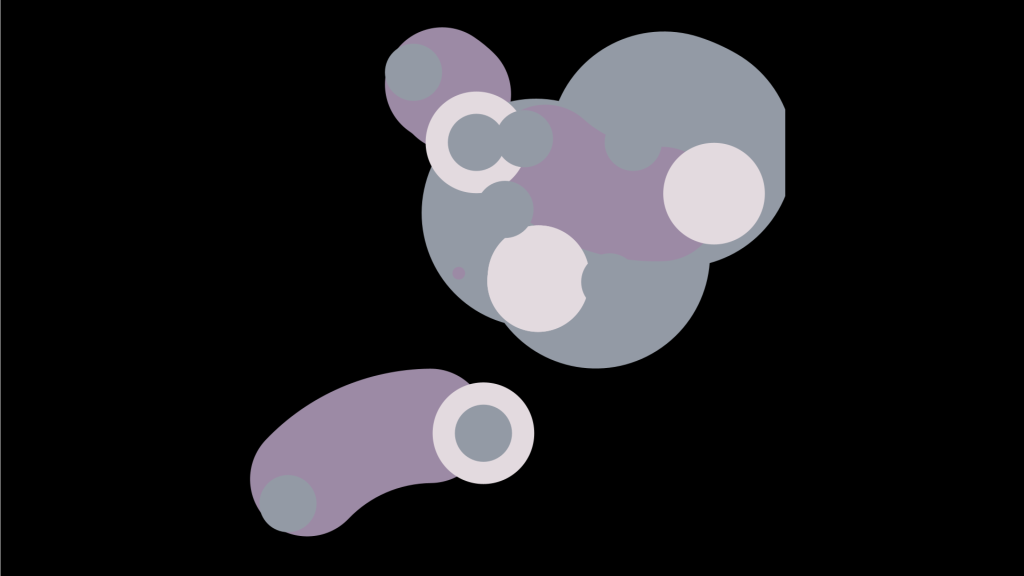
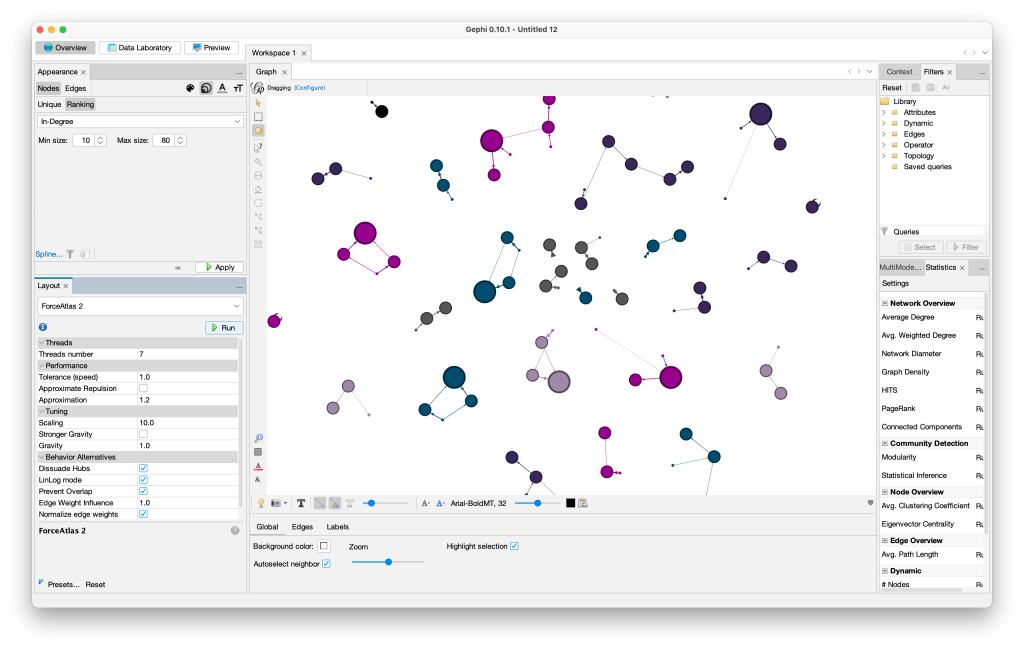
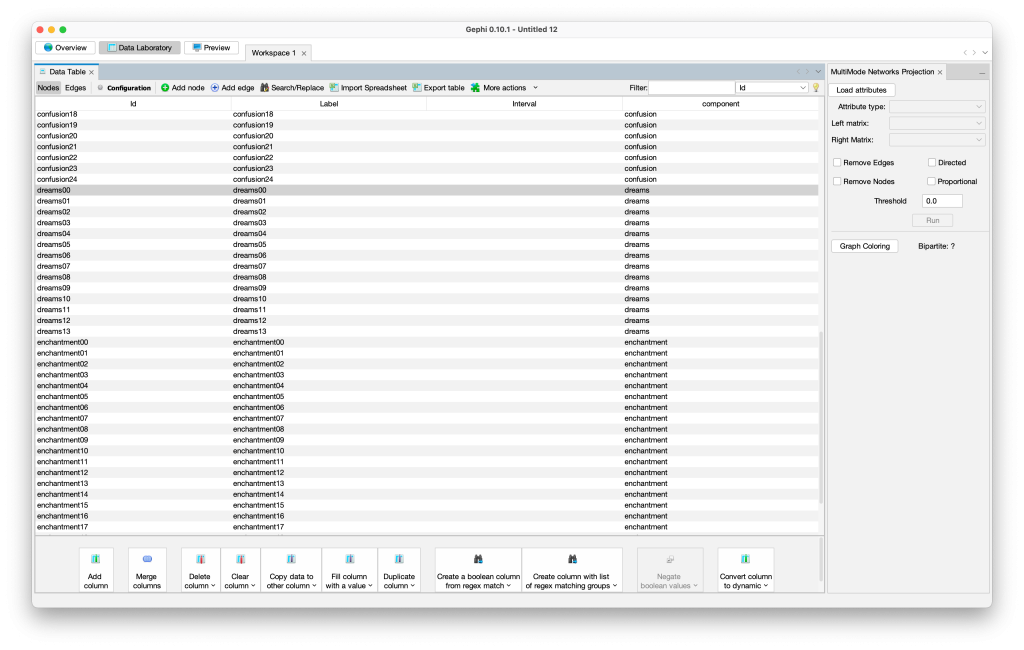

In this project, I used ‘Gephi’ to create visual effects by means of a non-artistic, mathematically organised system. I found that the interesting outcomes of a process could be ‘unexpected but correlative, emergent patterns’ by setting up a logical constraint.
Written Response
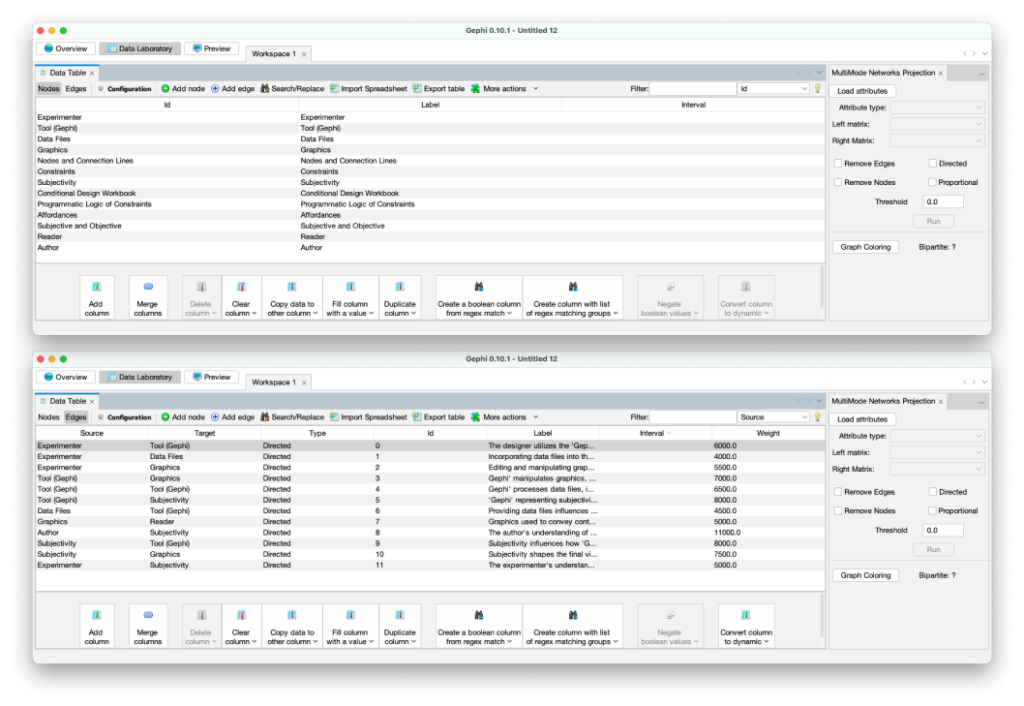
In the process of creating my written response, I referred to the Cross Year Studio: Technology 2 workshop held at CSM in 2024. 01. 26. In this class, I noticed similarities between the way the AI generator ‘Chat GPT’ reads text and the way the ‘Gephi’ tool interprets data: both tools simplify words and then interpret them by creating a network map of related actors. Therefore, to render a written response, I used Chat GPT to tokenise the text and then linked the actors together to create a data file for Gephi.

First I wrote a prompt to create a list of actors to serve as nodes. I then rewrote the prompt with conditions to convert it to the system I had created. Based on the conditional prompt, it sorted the actors by “relationship” and frequency of mention.
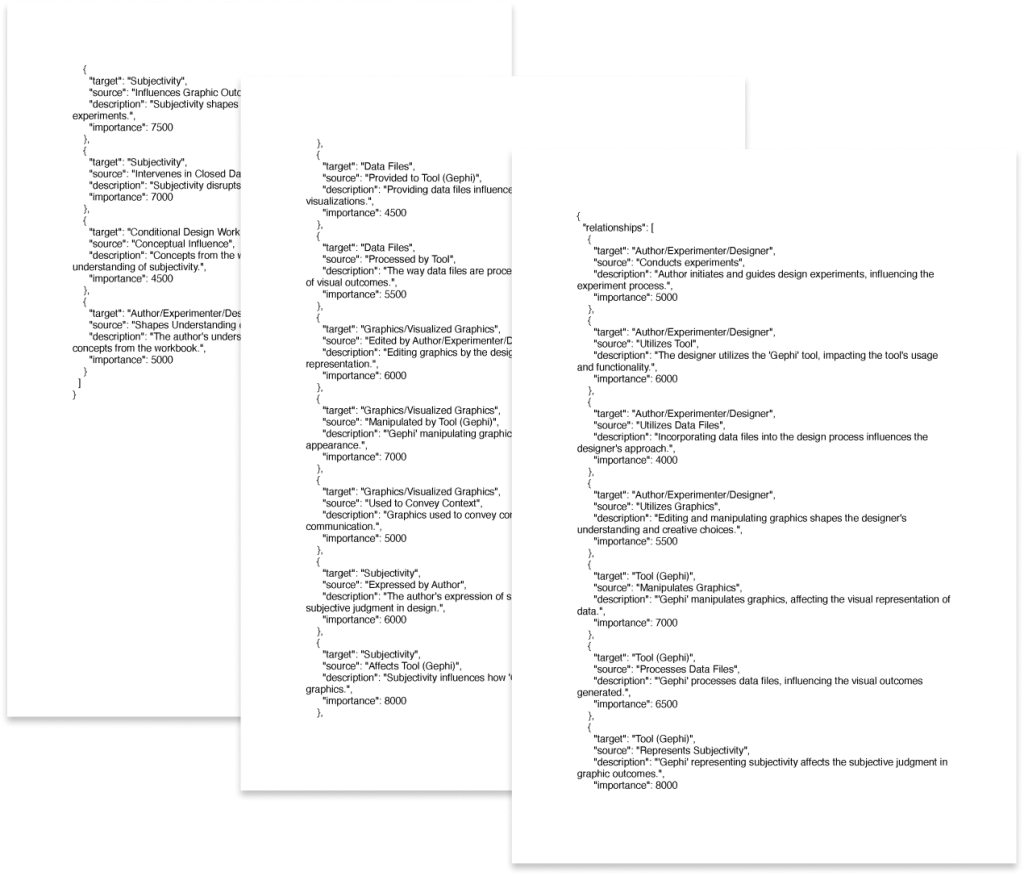
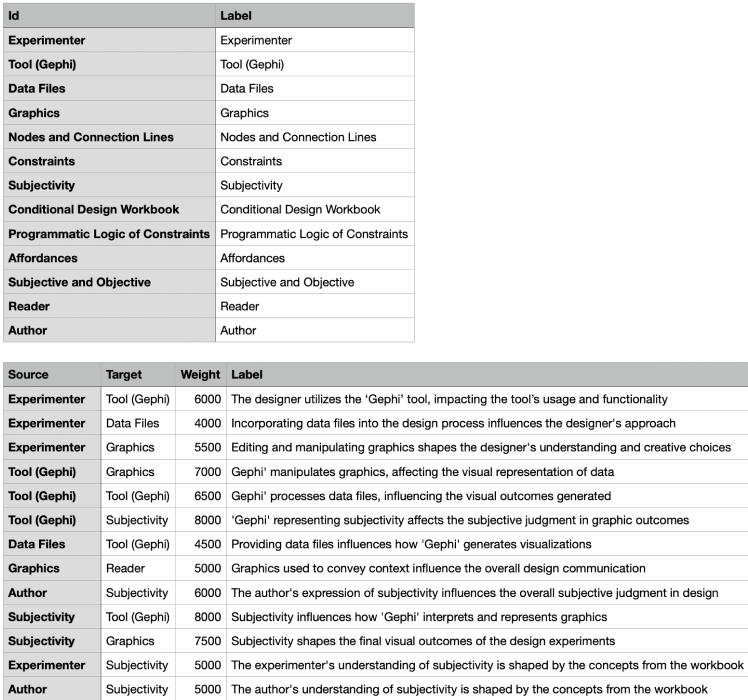
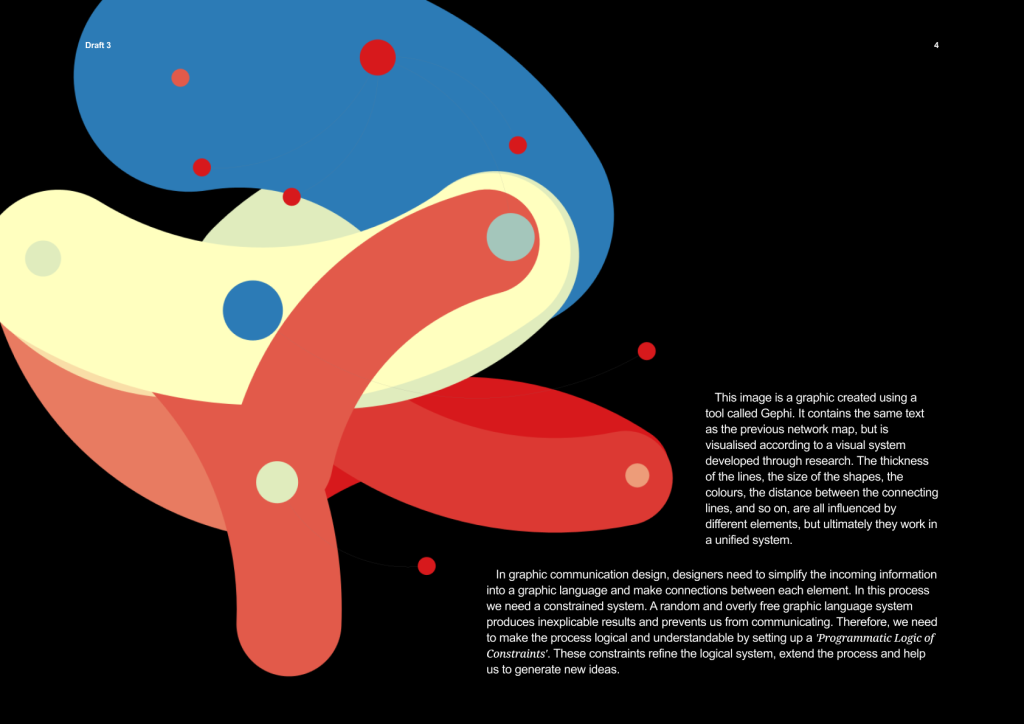
In graphic communication design, designers need to simplify the incoming information into a graphic language and make connections between each element. In this process designers need a constrained system. A random and overly free graphic language system produces inexplicable results and prevents us from communicating. Therefore, designers need to make the process logical and understandable by setting up a ‘Programmatic Logic of Constraints’. These constraints refine the logical system, extend the process and help us to generate new ideas.
Feedback:
- It’s a systematic exploration. And each process was linked each process
- You shift the purpose of the tool from network visualising to the multiple visualisation tool.
Bibliography
Conditional Design Workbook, Amsterdam: Valiz, 2013
Data Flow: Visualising Information in Graphic Design,Robert Klanten, Nicolas Bourquin, Thibaud Tissot, Sven Ehmann, 2008