Y1U1W2
Methods of Iterating
Next, as a way of continuing this critical examination of your tool or medium, develop an iterative experiment that ‘hacks’ it to do something that it is not intended to do. Consider how you can subvert its primary function, use, or context—in other words, what it does, how it does it, or what it does it for—as a way of interrogating it.
Remember: The focus is on developing a critical enquiry through rigorous, systematic, and continuous exploration. This means that you should develop an approach to your tool that you can deepen through iteration (instead of just making one piece that illustrates a fixed idea).
Hack
break into the tool and take control of it.
Exploring ‘Gephi’
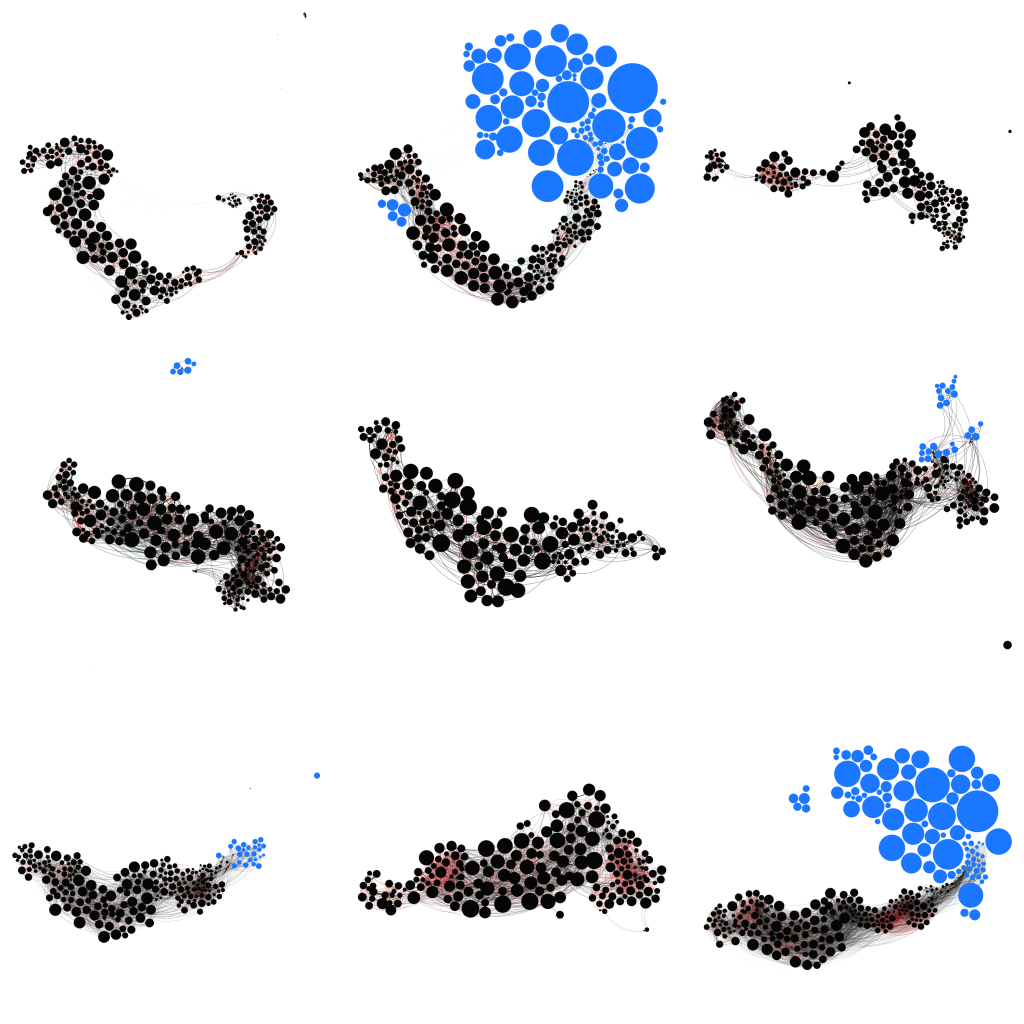
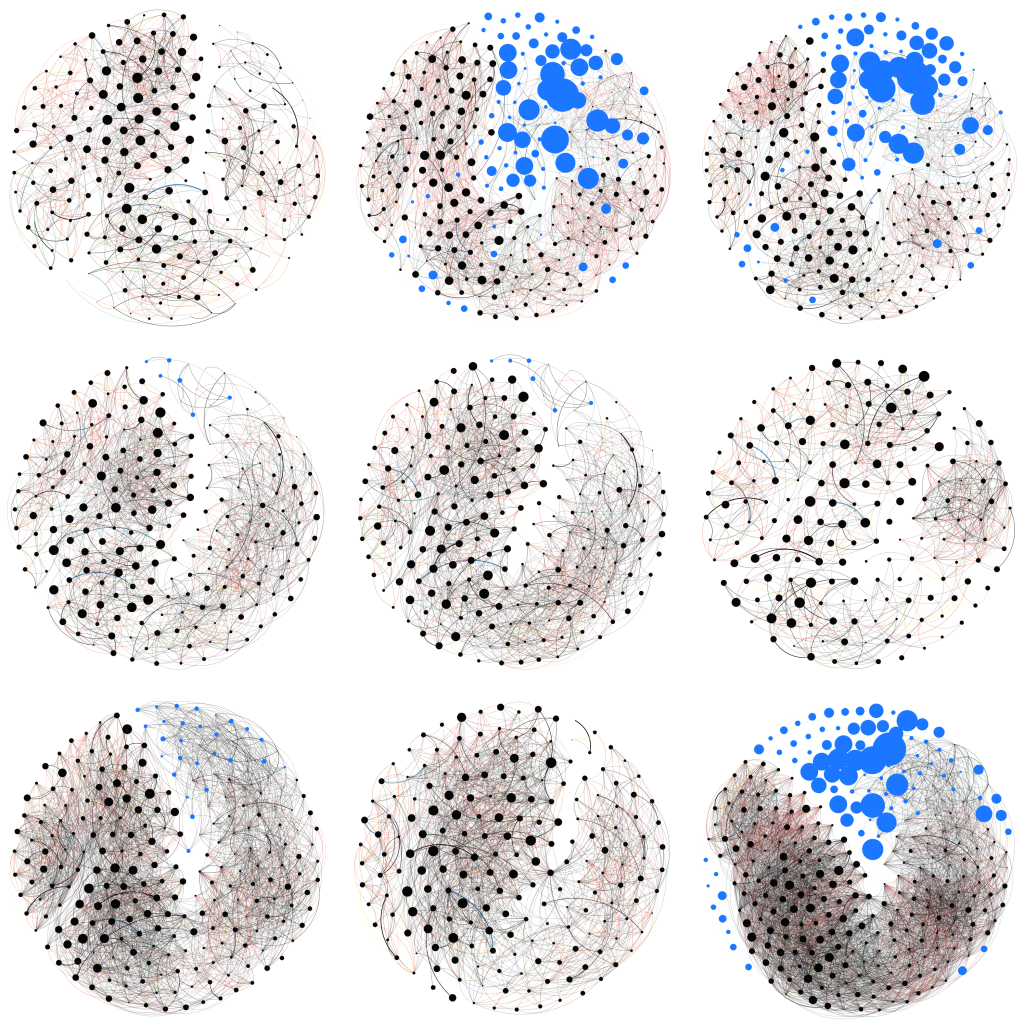
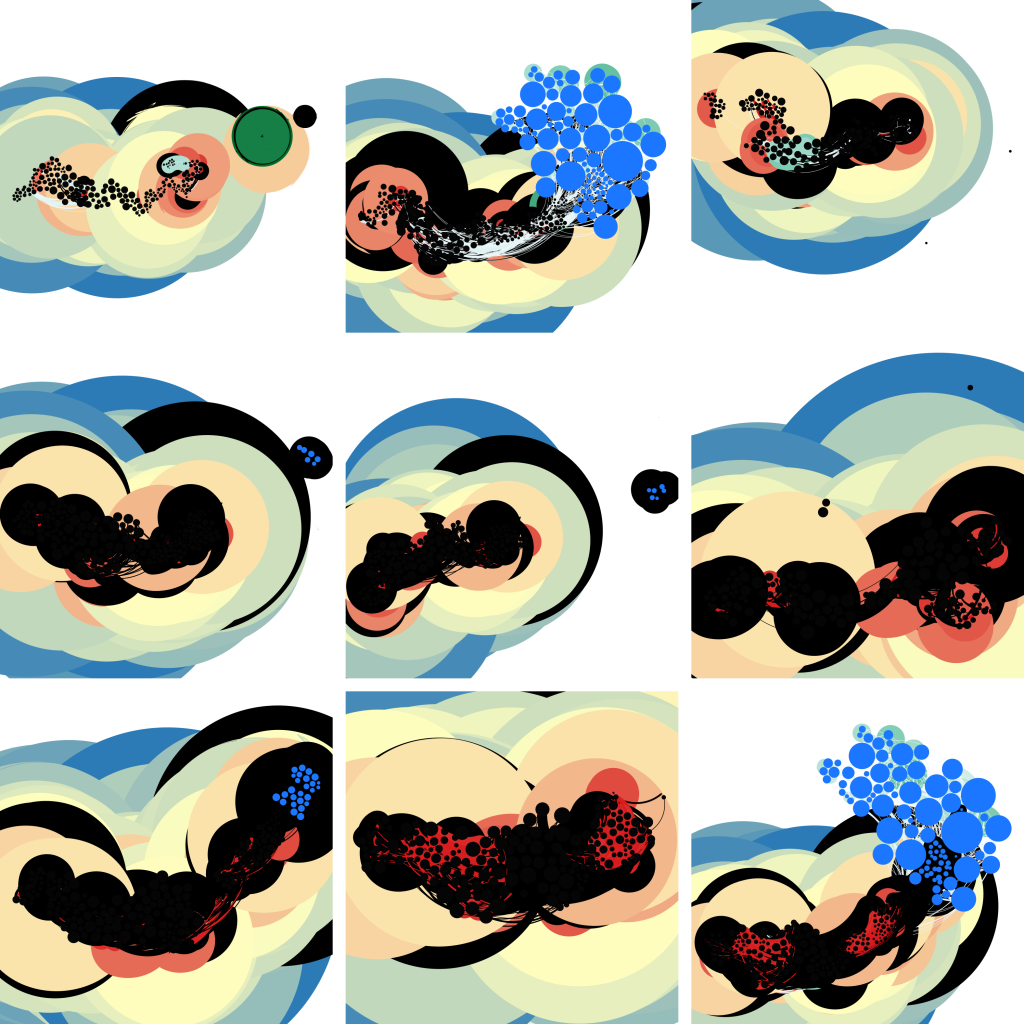
This week, I explored ‘Gephi’ with the question, “How can graphic designers convey a sense of context in a design environment where visual representation is extremely limited?”.
To explore diverse tool functionalities within a limited environment, I experimented with dynamic data files to create networks with various layouts, and sequences.
With this data, I could generate a variety of graphic representations, which was different from previous projects where I had worked with static data for visualisation.
Hack′
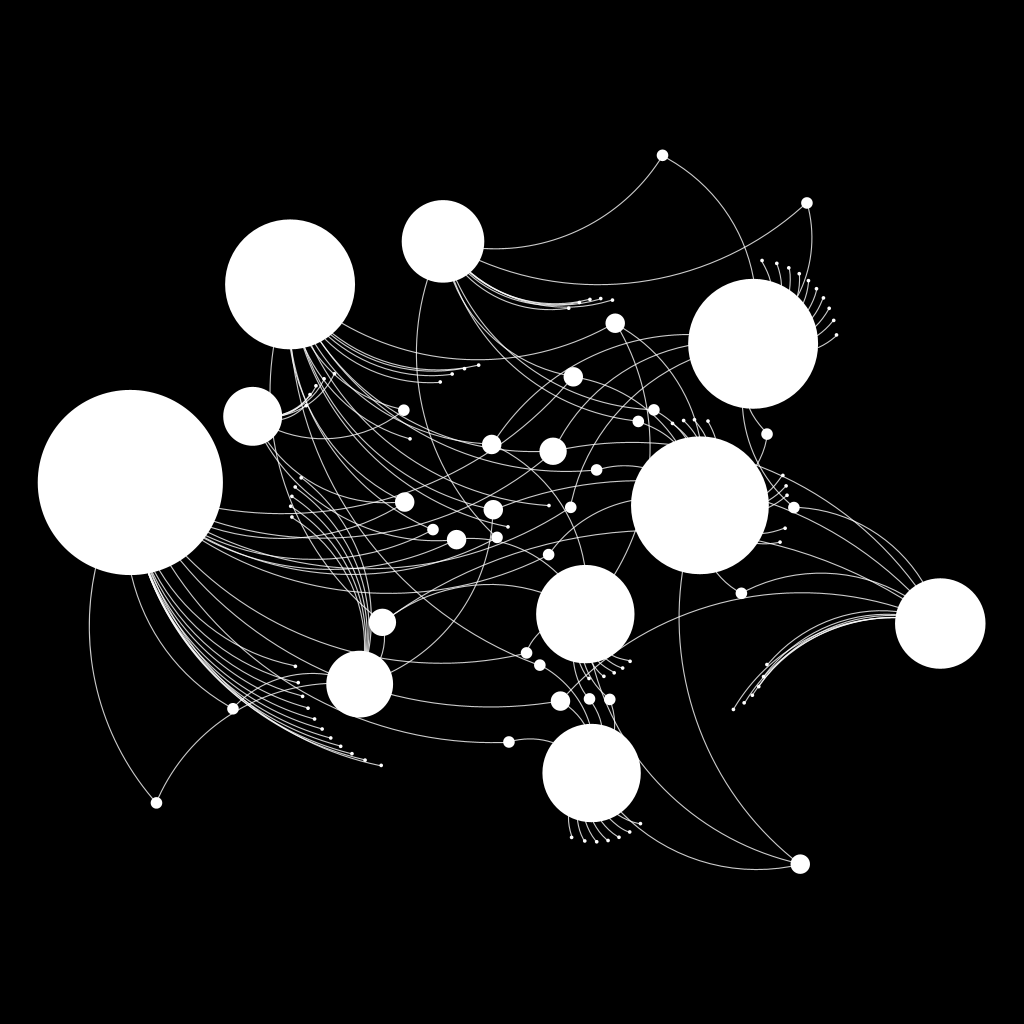
During my first week of research, I realised that I had already tried ‘hacking’ once: in a program that analyses network graph and connectivity, I used it as a graphic editing tool. I experimented with moving nodes around, deleting them, and applying the same colour to groups that were out of hierarchy, breaking the traditional order.
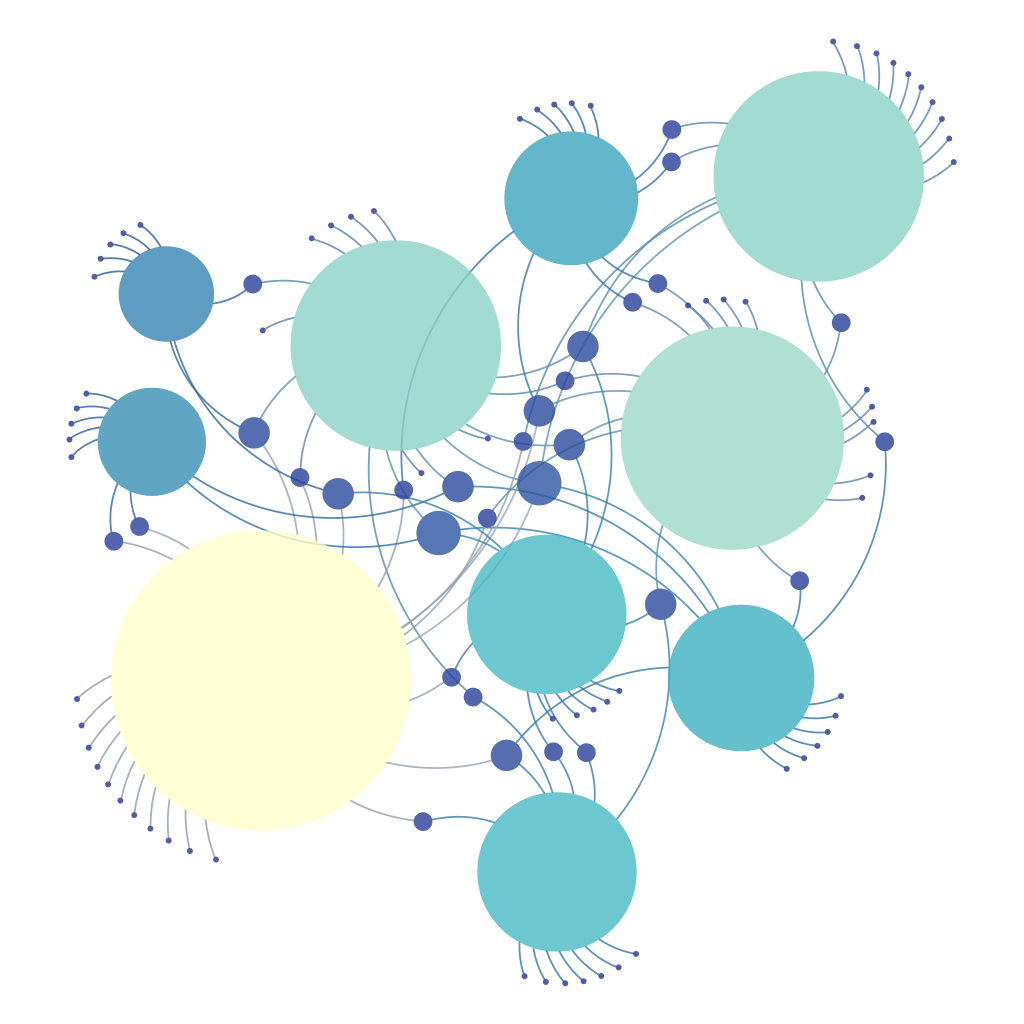
Reconfigured Nodes


Hack″
In an environment where graphical representation is limited, I was considering whether the content could be conveyed in other formats. If so, this brought me back to the question, “Do I need to convey information only in graphics?”. With a programme to visualise data as a graph, I explored the possibility of conveying it in the form of another file by going from graph to data.
This is where I became interested in extracting from the traditional data->graphic relationship to a graphic->data relationship.
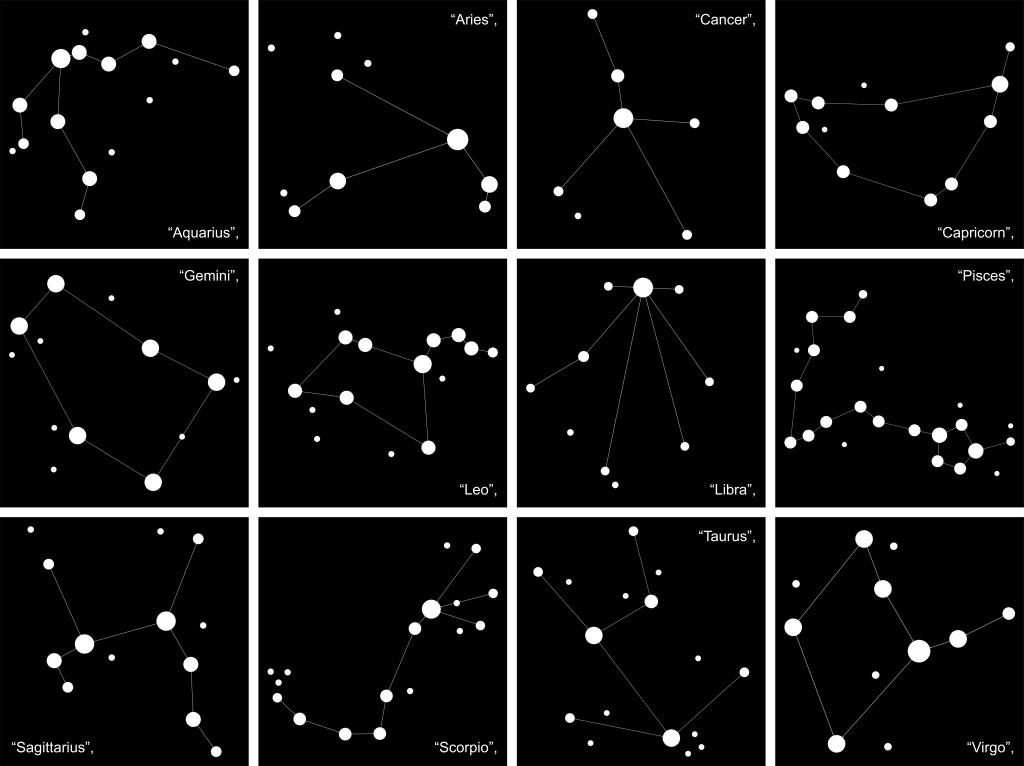
Therefore, I drew the nodes directly in Workspace and made new connections to each one. This filled the empty spreadsheet within the programme with data about the nodes and edges I had created on a purely visual basis. I proceeded to extract it to a data file, in the process reversing the order of inputs and outputs.
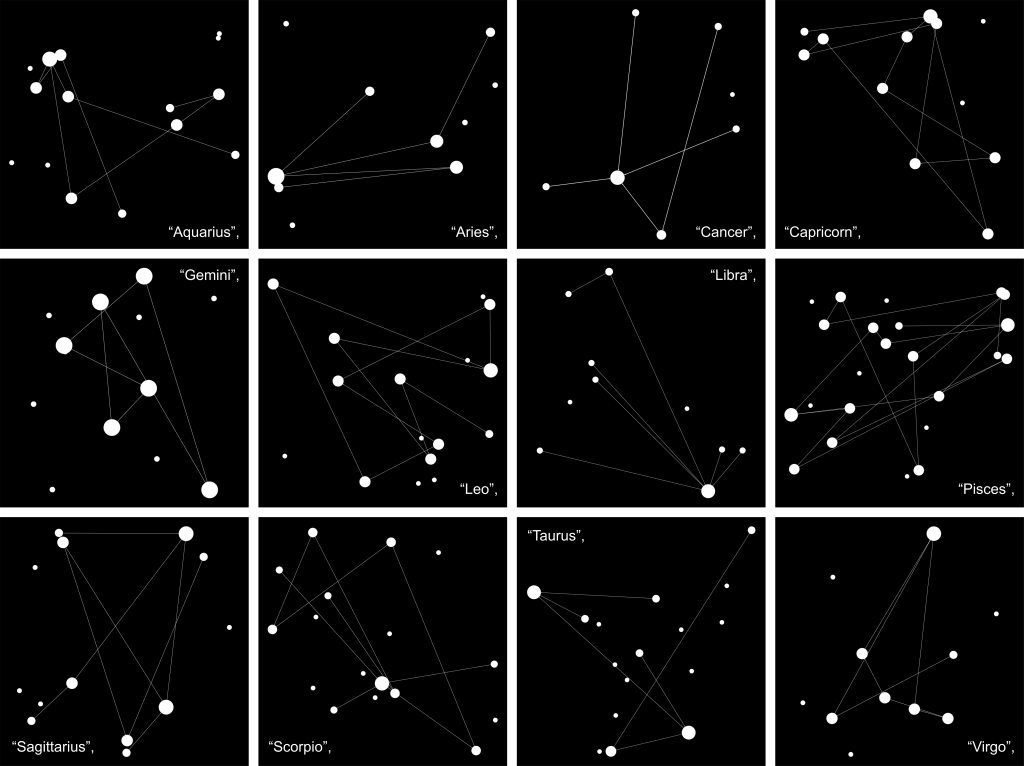
I re-imported this into Gephi to see the resulting graph. The nodes in the network were connected exactly as they had been set up, but their configuration had changed – Gephi had presented me with a new constellation that it had read from the existing data.
Overall,
As a result, in this week’s project, I experimented with going from data to graphic, graphic to graphic, graphic to data, and extracted data to another graphic. I found that graphic-to-graphic (copying the artist’s work) produced the most predictable and closed results, while graphic-to-data-graphic (constraining the graphic to data) produced the most unpredictable and open results.
By observing how the constraints represented in the data file were expressed differently depending on the environment, I was able to see the graphics that ‘Gephi’ was subjectively judging.
Feedback:
- Iteration (C) imagined abstract image (e.g.Swimming Whale)
- The graphics still have Network-looking.
- Use the tool for self-expression.
- You can focus on visual representation (look and feel) by using the tool ‘Gephi’ rather than data representation.
Question:
- How can I expand Gephi as a tool for systematic pattern design?